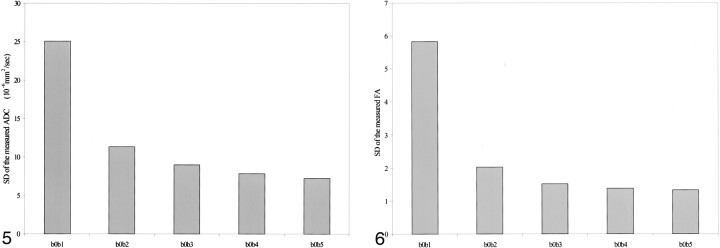
fig 5.
Graph of the average SD of ADCi for the different strengths of b values, obtained from the splenium of the corpus callosum, shows a significant difference between the b0b1 group and the remaining four groups.
fig 6. Graph of the average SD of FA for the different strengths of b values, obtained from the splenium of the corpus callosum, shows a significant difference between the b0b1 group and the remaining four groups.

