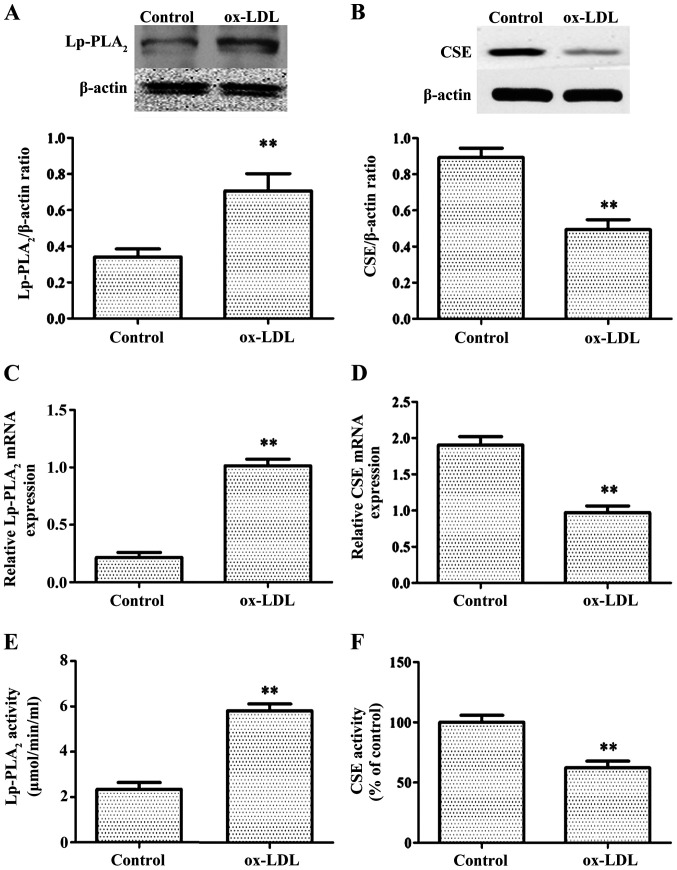
Figure 1.
ox-LDL induces Lp-PLA2 expression and inhibits CSE expression in THP-1 cells. Cells were treated with 50 µg/ml ox-LDL for 24 h. Relative protein expression levels of (A) Lp-PLA2 and (B) CSE were determined via western blot analysis. Relative mRNA expression levels of (C) Lp-PLA2 and (D) CSE were determined via reverse transcription-PCR. (E) Activity levels of Lp-PLA2 were determined using a Lp-PLA2 activity kit. (F) CSE activity was determined with a methylene blue spectrophotometric assay. The data are presented as the mean ± SEM (n=5). **P<0.01 vs. control. ox-LDL, oxidized low-density lipoprotein; Lp-PLA2, lipoprotein-associated phospholipase A2; CSE, cystathionine γ-lyase.

