fig 1.

Patient 5.
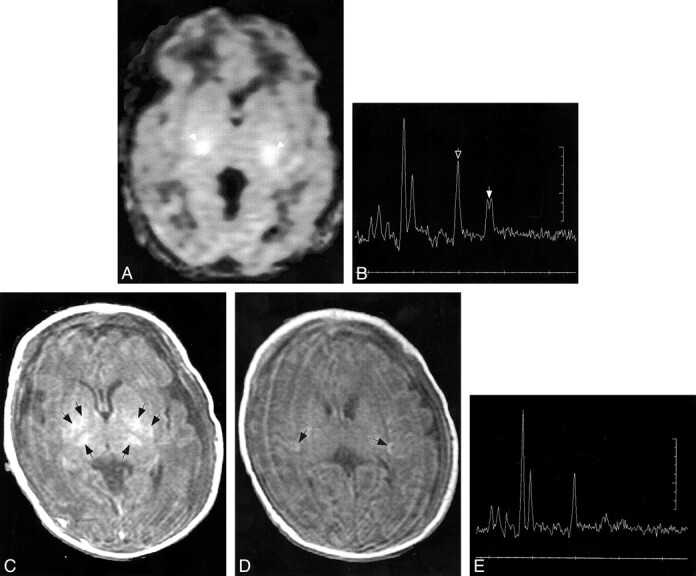
A, Diffusion-weighted image (b = 700 s/mm2) at age 16 hours. Small areas of reduced diffusion (arrows) are seen in posterior limbs of internal capsules.
B, Proton MR spectrum (2000/288) at age 16 hours from single voxel in thalamus/lentiform nucleus. Lactate peak (doublet at 1.33 ppm, indicated by solid arrow) is markedly elevated and NAA peak (singlet at 2.01 ppm, indicated by open arrow) is reduced.
C and D, Follow-up SE (517/8) images at age 15 days. Despite some motion degradation, globular T1 shortening (arrows) is seen in lateral putamen and posteromedial lentiform nucleus bilaterally and at the depths of the posterior sylvian cortex. Diffusion images were negative at this study.
E, Follow-up proton spectrum (2000/288) from the thalami/lentiform nuclei at age 15 days shows further diminution in the size of the NAA peak and almost complete disappearance of the lactate peak.
