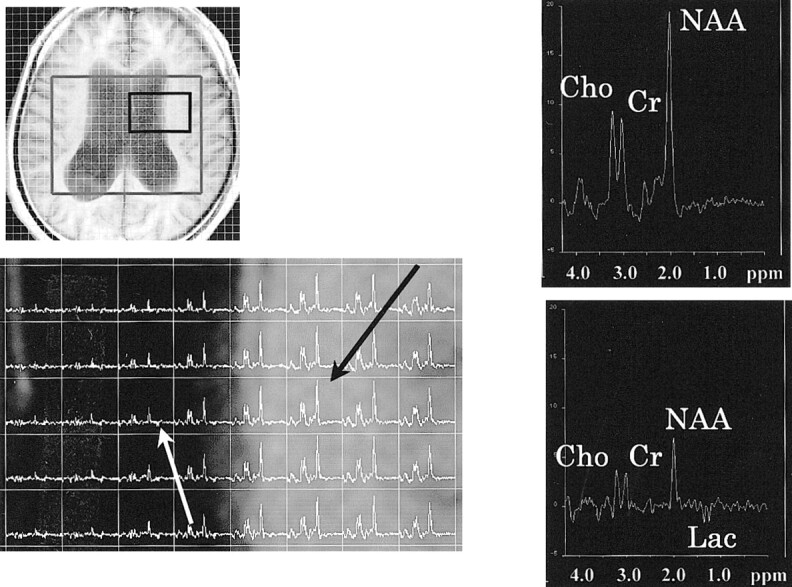
fig 1.

Proton MR spectra (TR/TE, 2000/135) in the patient with NPH. Upper left, axial T1-weighted MR image of the same patient. A box outlines volume of interest, which includes the bodies of lateral ventricles in the hemisphere. Lower left corner shows spectra from the body of the left lateral ventricle and surrounding parenchyma. The spectrum from the voxel of the parenchyma (black arrow) shows normal spectral pattern (upper right). The spectrum from the voxel in the body of left lateral ventricle (white arrow) shows the lactate peak (lower right). NAA, Cho, and Cr peaks also are observed, suggesting that this intraventricular voxel contains periventricular brain tissue
