fig 1.

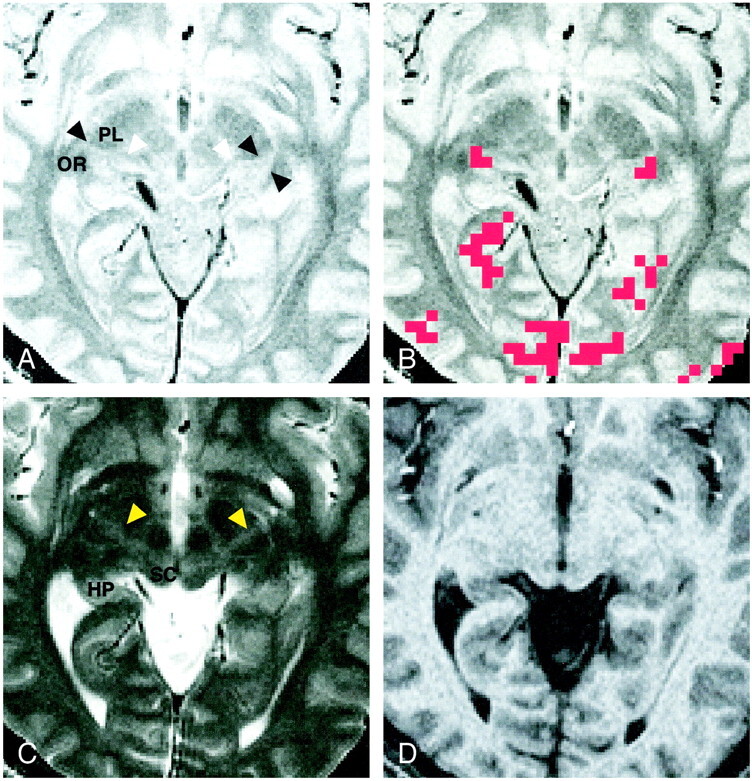
Images of participant 3. All images were obtained 4 mm inferior to the bicommissure line.
A, Proton density–weighted image (3000/14/2) shows the LGN (black arrowheads) bordered sharply by the optic radiation (OR) and the posterior limb of the internal capsule (PL). The medial geniculate nucleus can be seen as a small rounded eminence adjacent to the ambient cistern (white arrowheads).
B, Activation map superimposed on the proton density–weighted image shows 3-pixel clustered activation at the anatomically identified location of each LGN. Red pixels represent activation.
C, T2-weighted image (3000/85/2). The LGN is only faintly visible and its borders are difficult to identify. Note the bandlike areas of slightly higher intensity, compared with the surrounding area, in the posterior third quarter of the posterior limb (arrowheads). SC indicates the superior colliculus; HP, hippocampus.
D, T1-weighted magnetization-prepared rapid gradient-echo image (13.5/7/2; inversion time, 300 ms; resectioned). The LGN is only faintly visible, and its borders are difficult to identify.
