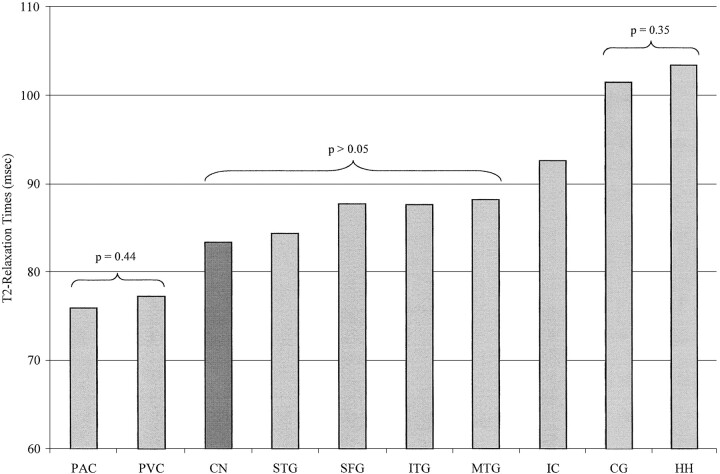
fig 3.
Bar graph of the mean T2 relaxation times in one deep gray matter region, the caudate nucleus (CN), and nine cortical regions: primary auditory cortex (PAC), primary visual cortex (PVC), superior temporal gyrus (STG), superior frontal gyrus (SFG), inferior temporal gyrus (ITG), middle temporal gyrus (MTG), insula cortex (IC), cingulate gyrus (CG), and hippocampus (HH). On the basis of the T2 values, the gray matter structures can be divided into four statistically different groups

