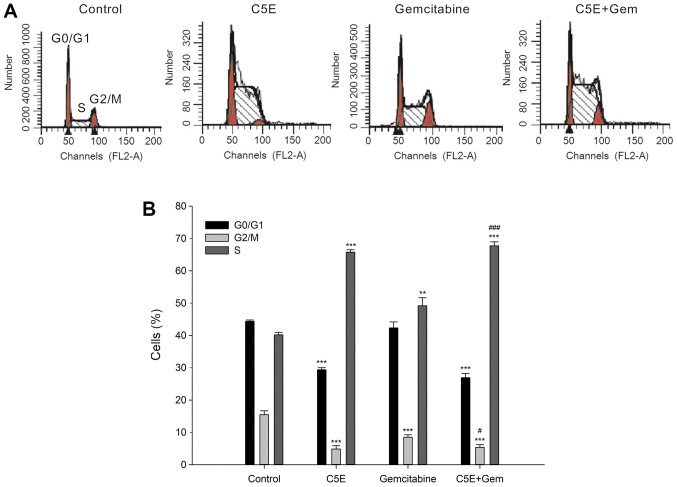
Figure 1.
Induction of S phase cell cycle arrest following the treatment with C5E and/or gemcitabine. (A) Cell cycle analysis was performed using ModFit software following propidium iodide staining in the different treatment groups and flow cytometry. (B) Percentage of cells at each stage of the cell cycle in the different treatment groups. **P<0.01, ***P<0.001 vs. the respective phase of the control group; #P<0.05, ###P<0.001 vs. respective phase of gemcitabine.

