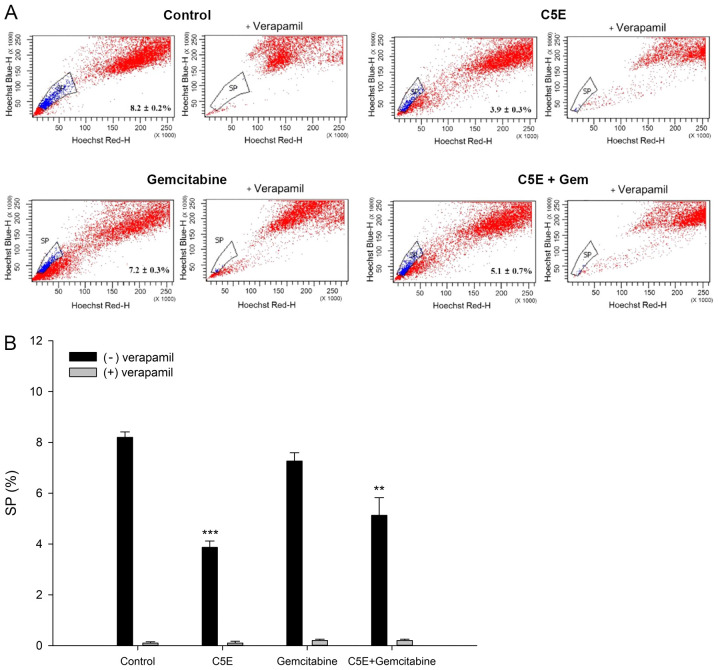
Figure 3.
SP analysis following the treatment with C5E and/or gemcitabine. PANC-1 cells were treated with C5E and/or gemcitabine for 72 h. (A) Proportion of SP and non-SP cells was analyzed in the presence of Hoechst 33342 or Hoechst 33342 plus verapamil (an inhibitor of multidrug resistance protein) using a FACSAria flow cytometer. (B) Quantification of the SP in each treatment group form part (A). **P<0.01, ***P<0.001 vs. control (−) verapamil. SP, side population.

