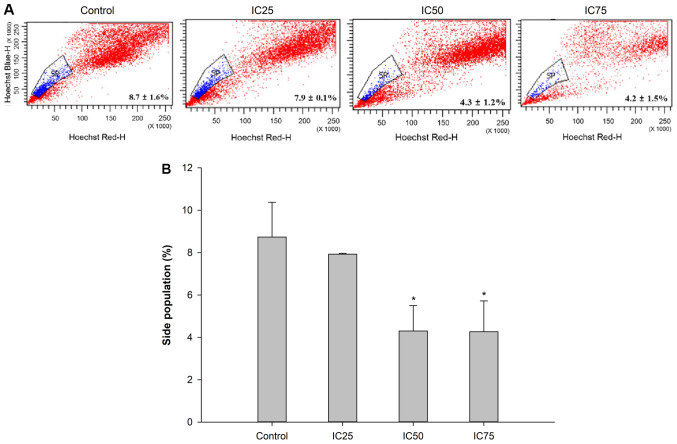
Figure 4.
SP analysis following the treatment with different concentrations of C5E. PANC1 cells were treated with C5E at the IC25, IC50 and IC75 doses for 72 h. (A) Proportion of SP and non-SP cells was analyzed in the presence of Hoechst 33342 or Hoechst 33342 plus verapamil on a FACSAria flow cytometer. (B) Quantification of the SP in each treatment group from part (A). *P<0.05 vs. control. SP, side population.

