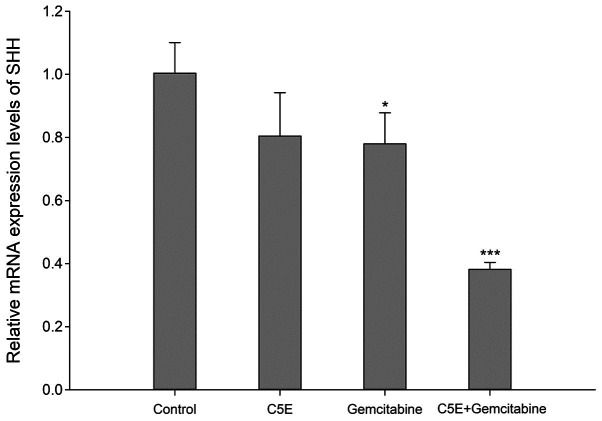
Figure 5.
Expression levels of SHH in PANC-1 cells in the presence of C5E, gemcitabine or the combination treatment. mRNA expression levels of SHH were determined using reverse transcription-quantitative PCR. The housekeeping gene GAPDH was used as the internal control for normalization. The mean values of the fold change in mRNA expression levels for the SHH gene in each treatment group relative to the control are shown. Data are expressed as the mean ± SD of ≥3 independent experiments. *P<0.05, ***P<0.001 vs. control. SHH, sonic hedgehog.

