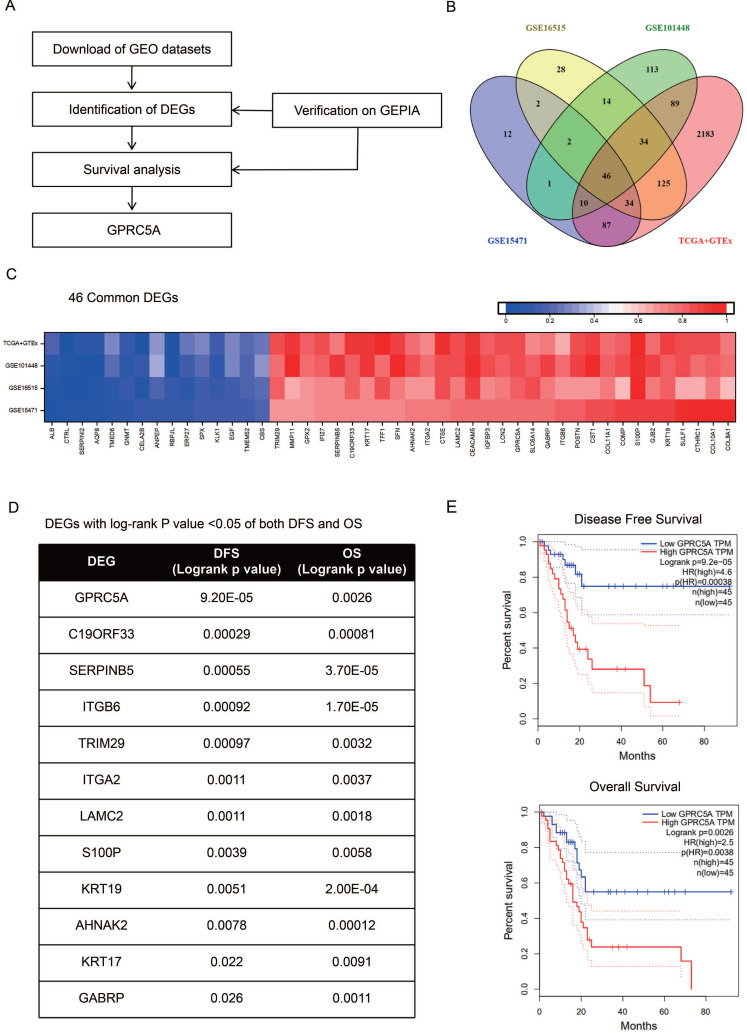
Figure 1.
Identification of GPRC5A as a significant gene with prognostic value in PaCa. (A) Flow chart of selection. (B) 46 common DEGs between GSE15471, GSE16515, GSE101448 and TCGA plus GTEx datasets. (C) Log FC values of 46 common DEGs in GSE15471, GSE16515, GSE101448 and TCGA plus GTEx datasets. The red grids represent up-regulated genes and the blue grids represent down-regulated genes. (D) The genes with log rank P value <0.05 of both DFS and OS. (E) The DFS and OS Kaplan-Meier curves of GPRC5A. The red curve represents GPRC5A high-expression group and the blue curve represents GPRC5A low-expression group.

