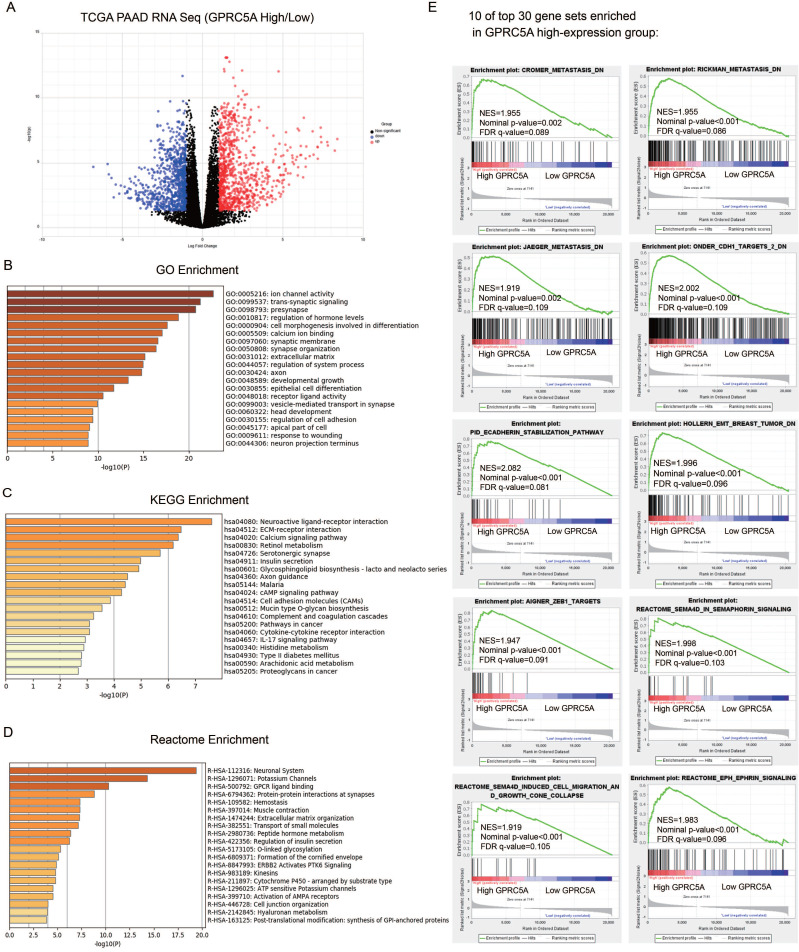
Figure 5.
Identification of DEGs between GPRC5A high-expression and low-expression groups, and enrichment analyses of DEGs. (A) Volcano plot of all DEGs between GPRC5A high-expression and low-expression group. Up-regulated genes, down-regulated genes and unchanged genes were marked as red, blue and gray dots, respectively. (B) Top 20 terms of GO enrichment analysis of DEGs. (C) Top 20 pathways of KEGG enrichment analysis of DEGs. (D) Top 20 terms of enrichment analysis in Reactome Gene Sets. (E) 10 of top 30 gene sets enriched in GPRC5A high-expression group analyzed by GSEA.

