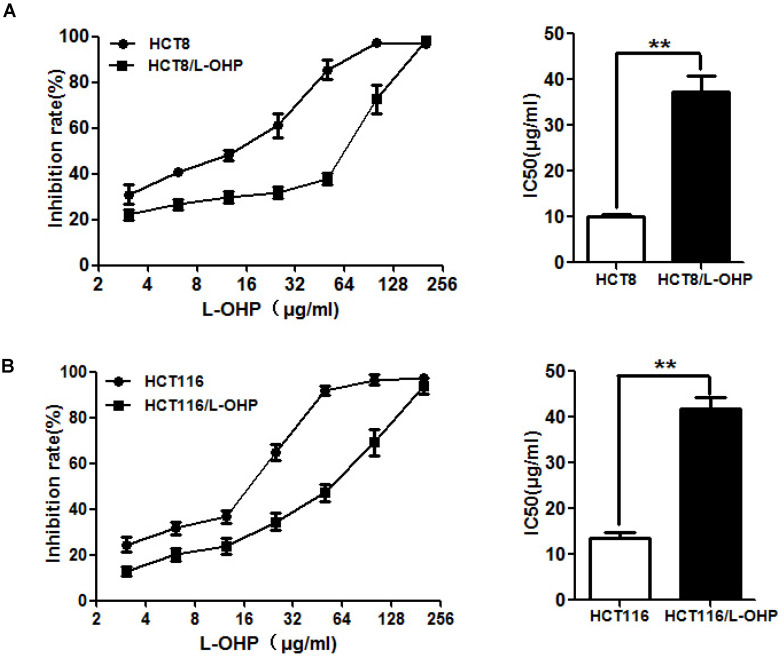
Figure 1.
Evaluation of drug resistance in the HCT-8/L-OHP and HCT116/L-OHP cell lines. (A) Left panel: HCT-8/L-OHP and parental HCT-8 cells were treated with increasing doses of L-OHP for 72 h and analyzed by a CCK8 assay; Right panel: The IC50 values were calculated using GraphPad Prism 5.0. (B) Left panel: HCT116/L-OHP and parental HCT116 cells were treated with increasing doses of L-OHP for 72 h and analyzed by a CCK8 assay; Right panel: The IC50 values were calculated using GraphPad Prism 5.0. The data are expressed as the mean ± SEM values (n=3). *P < 0.05, **P < 0.01.

