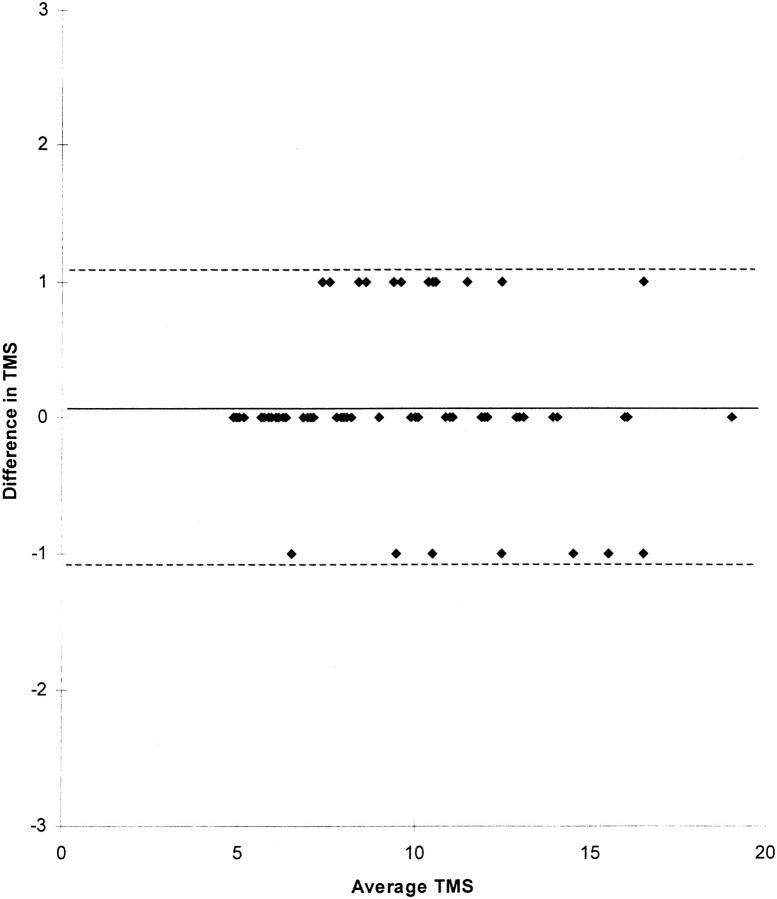
fig 7.
Bland-Altman plot with average TMS for each infant plotted against the difference in TMS between the observers for that infant. The points have been separated so that each infant can be identified. The solid line represents the mean difference in score (0.07); dotted lines represent 2 SD from the mean (1.12)

