fig 3.
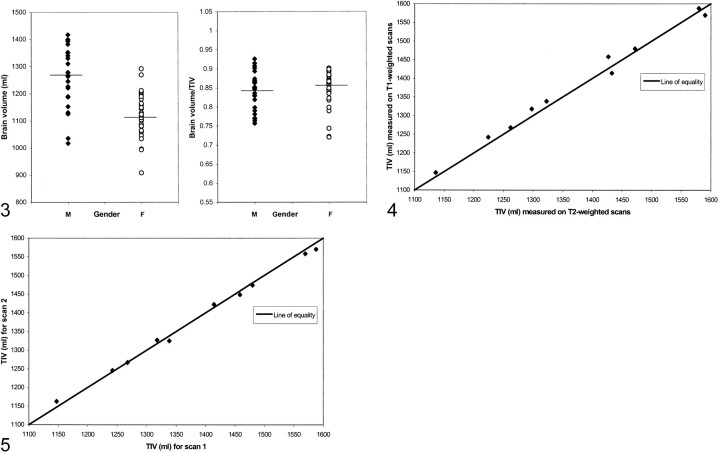
Brain volumes and normalized brain volumes in male (M) and female (F) controls with group averages marked, showing a reduction in sex-dependent differences after TIV normalization.fig 4. Comparison of TIV measurements from T1- and T2-weighted MR images in five controls and five AD patients.fig 5. Serial T1-weighted TIV measurements in five controls and five AD patients

