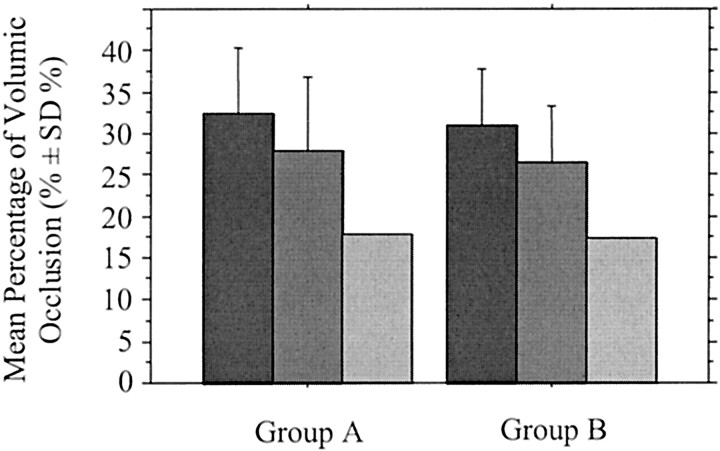
Fig 5.
Graph shows the mean percentage of volumic aneurysmal occlusion according to degree of angiographic occlusion at completion of the initial endovascular treatment in group A (neck ≤ 4 mm) and group B (neck >4 mm). Percentage of volumic occlusion was not significantly different between the two groups (P = .247). Dark gray bars indicate complete occlusion; medium gray bars, near complete occlusion; light gray bars, incomplete occlusion.

