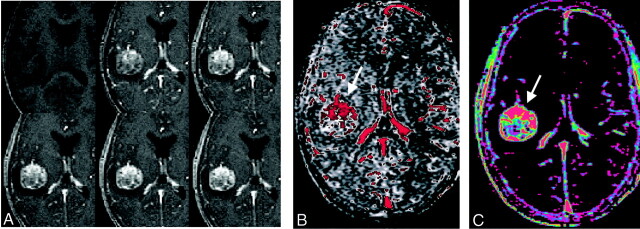
Fig 3.
A, Representative images from the dynamic contrast-enhanced MR study in the patient in (Figure 2. As seen on the CT scans Fig 2), contrast enhancement is strong and immediate, and wash-out is slow. After the injection of contrast agent, the tumor is immediately and strongly enhancing (top row, middle and right images), and it remains hyperintense relative to the vascular signal intensity (bottom row).
B and C, Pixel-by-pixel parameter maps of CBV (B) and PS (C) from the section in A. As seen on the CT maps, blood volume is increased mostly in the more anterior tumor areas (B, arrow). Permeability is highest in the more anterior and peripheral tumor areas (C, arrow) as well.

