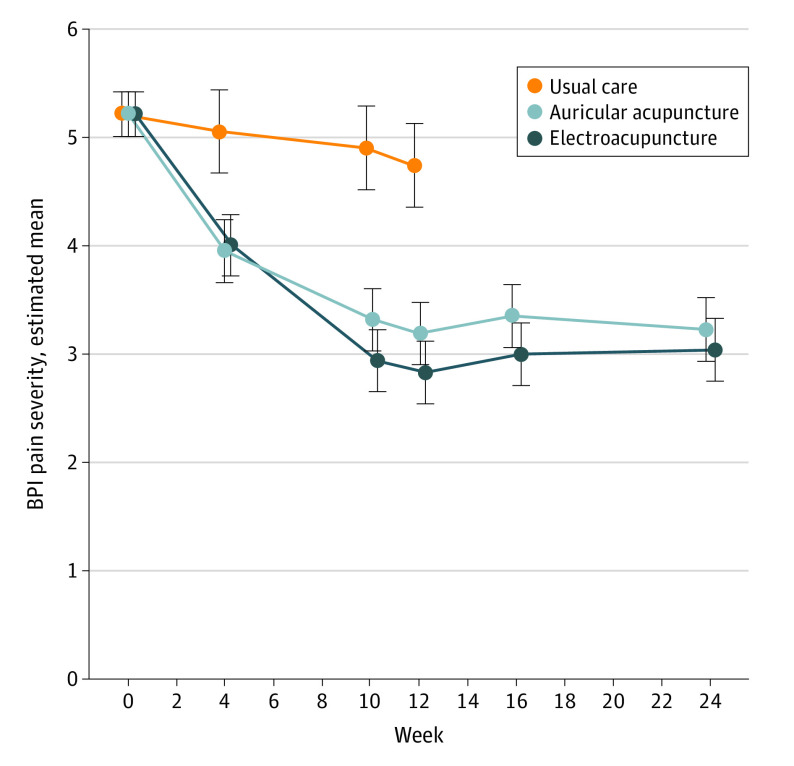
Figure 2. Brief Pain Inventory (BPI) Pain Severity Scores Over 24 Weeks.
The BPI pain severity scores range from 0 to 10, with higher scores indicating worse pain. Data points represent the model-estimated BPI score means, and 95% CIs (indicated by error bars) are from a linear mixed model with baseline means constrained to be equal across study arms. The dependent variable vector included the prerandomization baseline (week 0) assessment, as well as all postrandomization assessments at weeks 4, 10, 12, 16, and 24. The independent variables were the randomization stratification variables (accrual site and baseline opioid use), treatment arm, week (categorical), and the arm-by-week interaction. A patient-level random intercept was included in the model to account for the repeated outcome measurements within patients.

