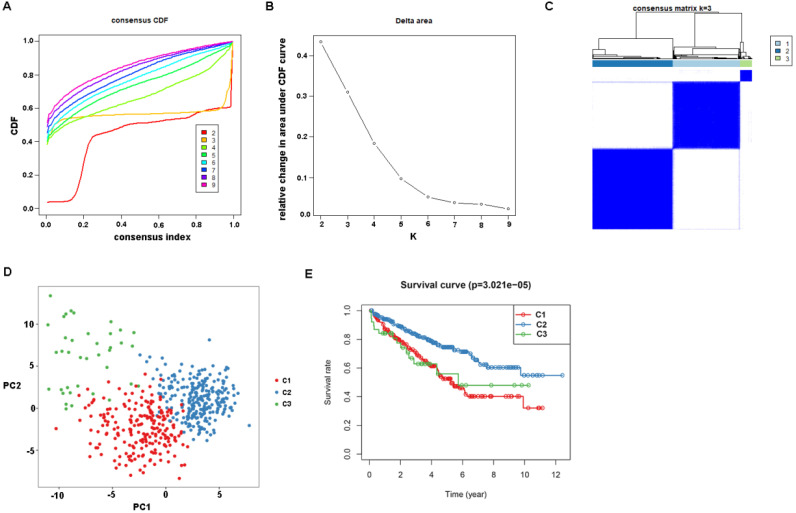
Figure 1.
Identification of tumor suppressor gene-related subtypes of ccRCC in TCGA dataset. (A) The cumulative distribution function (CDF) curves, which can described the probability distribution of a real random variable, and established using consensus clustering approach. CDF curves of consensus scores was calculated according to the different subtype number (k = 2, 3, 4, 5, 6, 7, 8, 9). (B) The CDF Delta area curve of ccRCC samples when k=3. (C) The heatmap of consensus matrix for three subtypes obtained by estimating of CDF curves. (D) Principal component analysis (PCA) of gene expression profile of the top 100 variance genes. Each sample is represented with a single point, with different color for each of the three subtypes. (E) Survival analysis for the three subtypes.

