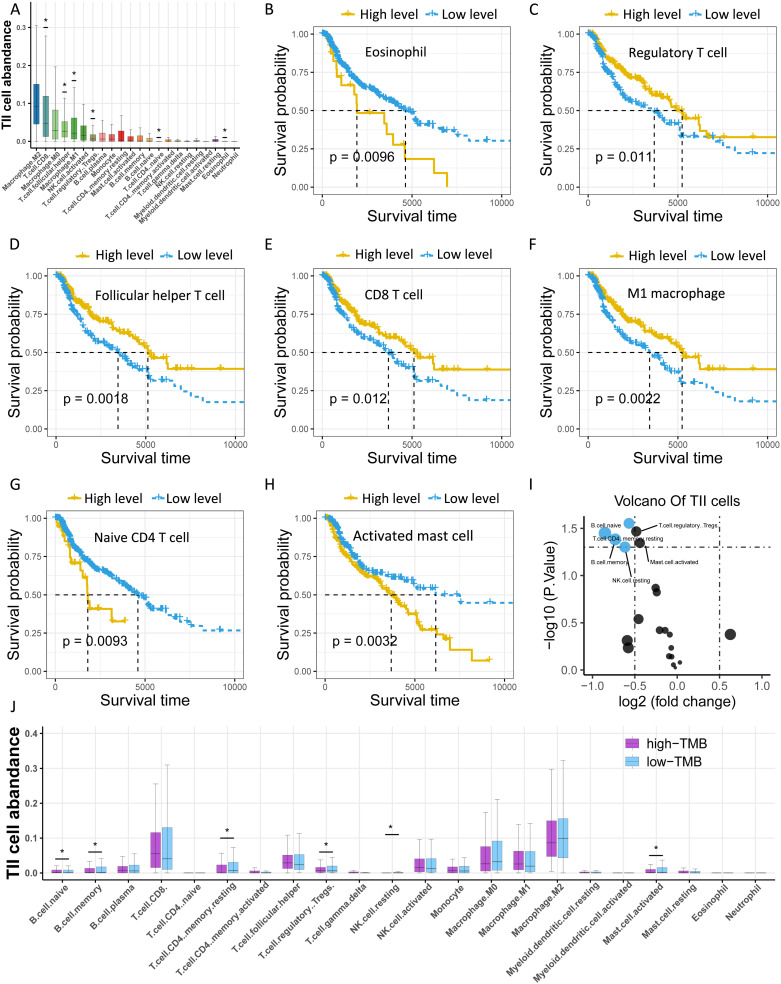
Figure 4.
Investigation of the TMB-related TIICs. (A) Distribution of 22 types of TllCs in melanoma. Asterisk (*) represents the specific type of immune cells which is significantly correlated with survival. (B-H) Kaplan-Meier curves of relevant TIICs. (I) Volcano plot of differentially expressed TIICs between low- and high-TMB groups. (J) Box plots demonstrate differential expression levels of TIICs between low- and high-TMB groups. Asterisk (*) indicated a statistical significance. TIICs: tumor infiltrating immune cells.

