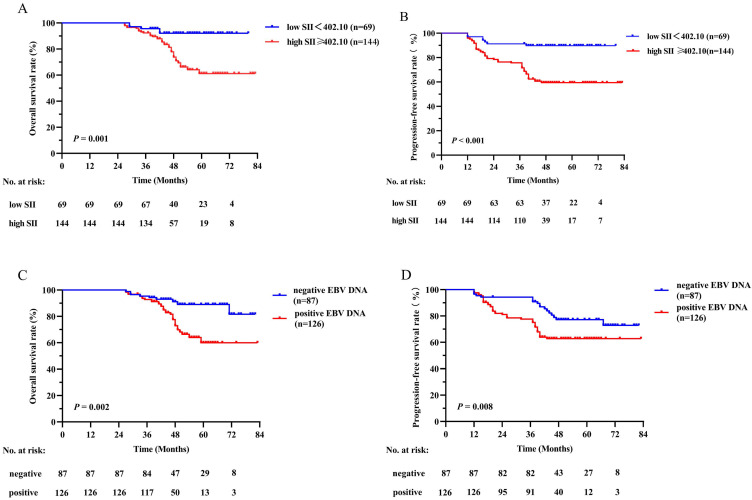
Figure 2.
Kaplan-Meier survival curves of OS (A) and PFS (B) between low and high SII groups; OS (C) and PFS (D) between negative and positive EBV DNA groups in the training cohort. Log-rank test, P < 0.05 was considered statistically significant. SII: systemic immune-inflammation index; OS: overall survival; PFS: progression-free survival; EBV DNA: Epstein-Barr virus DNA.

