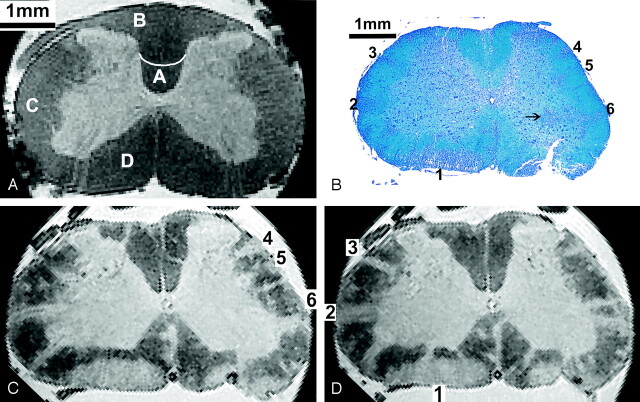
Fig 2.
Axial MR and histopathologic images of rat spinal cord.
A, Lumbar cord in a control rat. Letter A indicates the corticospinal tract; B, gracile fasciculus; C, lateral funiculus; and D, anterior/ventral funiculus.
B–D, Lumbar portion (L3) in a rat with grade 4 EAE. Multiple lesions (1–6) can be identified in the anterior and lateral parts of the white matter. Histologic section (LFB stain) in B shows an inflammatory infiltrate in the gray matter (arrow). Corresponding MR images in C and D, spaced 150 μm, account for the slightly different orientation of the axial plane introduced by histologic processing. Lesions 1–6 in A are shown.

