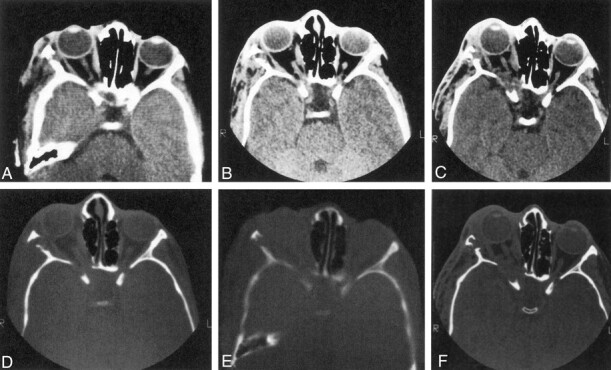
Fig 7.

Series of axial CT scans (soft-tissue and bone windows) obtained during three scanning sessions over several years show progression of sphenoid bone abnormalities over time. Note that the soft-tissue mass increases over time (original, A and D; 5 years later, B and E; and 10 years later, C and F). and the ipsilateral middle cranial fossa becomes progressively more enlarged.
