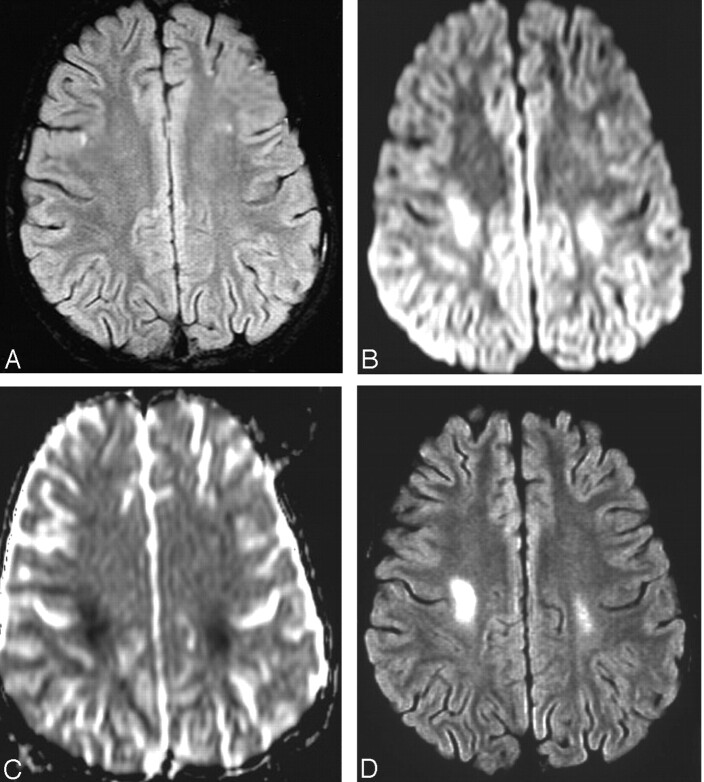
Fig 1.
Patient 3. MR imaging findings at the time of neurologic event (A–C) and at follow-up 2 months later (D).
A, Axial fat-suppressed FLAIR image (TR = 9000 msec; TE = 112 msec; TI = 2500 msec; acq = 1) shows no abnormality.
B, Axial diffusion image (B = 1000 s/mm2) shows high signal intensity at site of restricted motion of water in the parietal white matter of both hemispheres.
C, Axial ADC map shows hypointensity at affected sites. ADC measurements 50 s/mm2 (normal = 95 s/mm2).
D, Axial fat suppressed FLAIR image (TR = 9000 msec; TE = 112 msec; 1 = 2500 msec; acq = 1) shows bilateral abnormally increased signal intensity in white matter, right greater than left.

