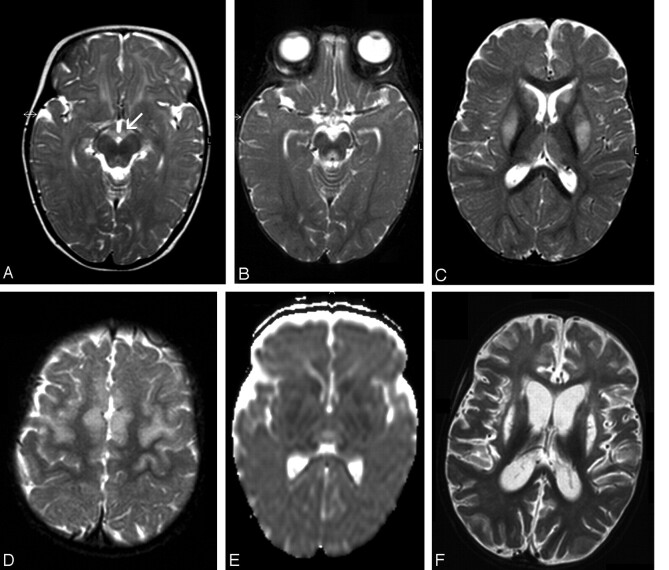
Fig 1.
Patient 1. Images at presentation (A) and follow-up 5 (B–E) and 45 (F) days later.
A, Axial T2-weighted image shows abnormal hyperintensity in the mammillary bodies (arrow) and tectum.
B–D, Axial T2-weighted images show abnormal hyperintensity in the periaqueductal region, thalami, basal ganglia, and frontal area. Lesions are bilateral and symmetric.
E, DWI (ADC) shows restricted diffusion in the basal ganglia. Thalami have hypointensity and hyperintensity, which are presumed to represent cytotoxic and vasogenic edema, respectively.
F, Axial T2-weighted image shows diffuse parenchymal loss, severe atrophy of the caudate nuclei, and necrosis of the putamina.

