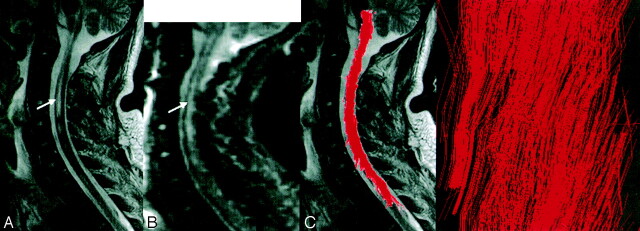
Fig 3.
Spinal cord sagittal T2-weighted MR (A) and diffusion-weighted b0 (B) images show wide intraspinal abnormal areas (arrows). Fiber tracking (C), coregistered and projected on a T2-weighted image, shows an unexpected unaltered shape of the white matter tracts, with visualization (D) of corticospinal tracts and nerve roots (arrowhead).

