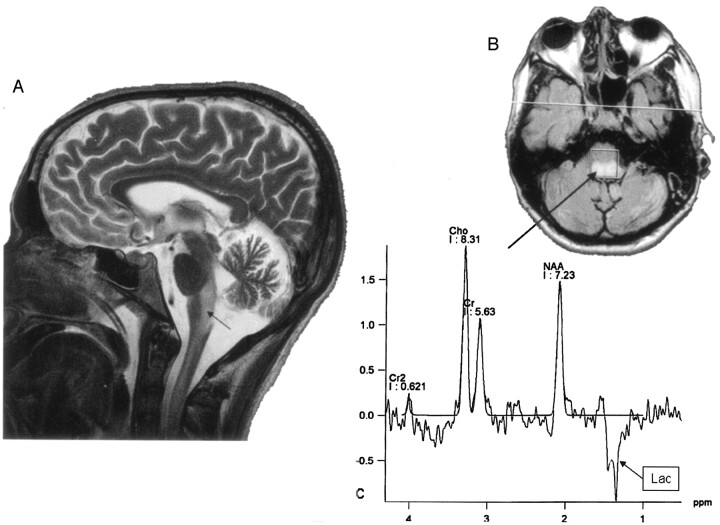
Fig 4.
Sagittal T2-weighted MR image (A) shows extensive abnormal areas involving the brain stem and the cervical spinal cord (arrow). A long TE MR spectroscopy voxel was located on fluid-attenuated inversion recovery abnormal areas in the medulla oblongata (B, arrow) and showed a spectrum with increased Cho peak, decreased NAA peak, and an inverted 1.3-ppm lactate peak (Lac, arrow box). Cr indicates creatine.

