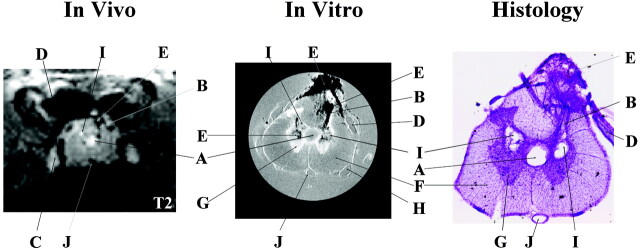
Fig 1.
Representative pathologic findings in the same animal (S05) at the same location observed in vivo (T2-weighted, TR/effective − TE = 2000 ms/62.5 ms; NA = 6), in vitro (TR/TE = 2500 ms/20 ms; NA = 8), and in histologic sections. Many of the same pathologic details are visible with all three methods albeit with different levels of resolution. In vivo and in vitro images are displayed with image size = 0.92 cm × 0.77 cm (in vivo) and 0.50 cm × 0.50 cm (in vitro). Letters label the most distinctive anatomic and pathologic characteristics observed in the three images as follows: A indicates expanded central canal; B, injection track; C, dorsal root ganglion; D, dorsal root; E, hemorrhage at injury site; F, white matter; G, gray matter; H, ventral root; I, cavity; J, anterior spinal vessel. In vivo images show cavitation as hyperintense signals due to T2 weighting, whereas, on in vitro images, cavities appear isointense in these proton attenuation-weighted images.

