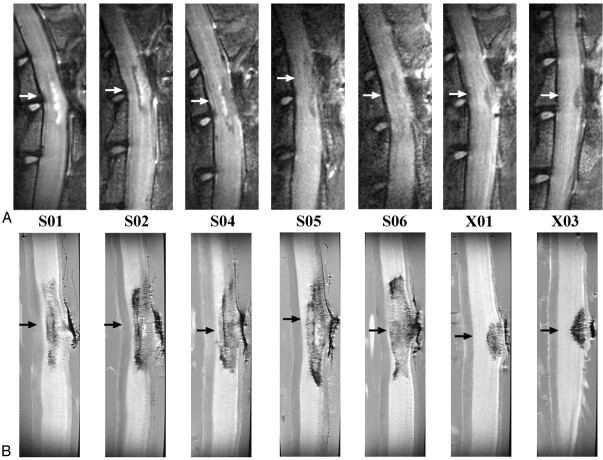
Fig 2.
A, In vivo (T2-weighted, TR/effective TE = 2000 ms/62.5 ms; NA = 6); and, B, in vitro (TR/TE = 2500 ms/20 ms; NA = 8) sagittal images for all QUIS-injured animals. Images are oriented with rostral at the top and dorsal on the right. Arrows represent the location of the epicenter of the injury. The epicenter was defined as the region of maximal pathologic damage. Displayed image size = 0.77 cm × 2.15 cm (in vivo) and 0.40 cm × 1.50 cm (in vitro). Animals designated S01, S02, S04, S05, and S06 received QL2, whereas animals designated X01 and X03 received QL1. The vertebral column and laminectomy site were easily observed in both in vivo and in vitro sagittal images.

