
Fig 3.
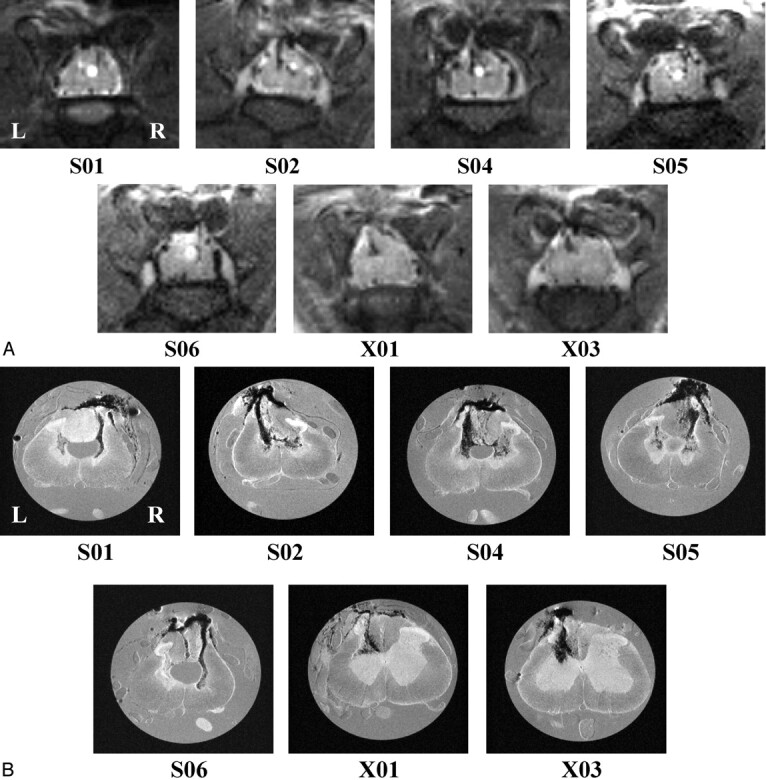
A, In vivo (T2-weighted, TR/effective − TE = 2000 ms/62.5 ms; NA = 6); and, B, in vitro (TR/TE = 2500 ms/20 ms; NA = 8) transverse images for all QUIS-injured animals. Images are sampled from the epicenter of the injury (arrows in Fig 2) and show comparable pathologic changes between methods. See Fig 1 for labeling of anatomic and pathologic findings. Images are oriented with dorsal at the top. L, left side of cord; R, right side of cord, for all images. Displayed image size = 0.92 cm × 0.77 cm (in vivo) and 0.50 cm × 0.50 cm (in vitro). A, Hypointense signals correlated with hemorrhage (see “Histologic Findings”) and hyperintense signals correlated with the presence of fluid filled cavities. For example, notice the hyperintense expanded central canal in the cord of animals S01, S02, and S04–S06 and the hyperintense cavity in the gray matter on the right side of the cord in animal S02. B, Hypointense regions were observed bilaterally in the gray matter in all QL2 animals (S01, S02, and S04–S06), whereas, in QL1 animals, evidence of hemorrhage was observed only ipsilateral to the side of QUIS injection (X01 and X03). In addition, hypointense areas were observed in the dorsal columns in all the QUIS-injured animals except S01. Central canal expansion was clearly defined in four of the five QL2 animals (S01 and S04–S06), and injection tracks were visible in all injured animals. Cavity formation was also seen in all QL2 animals bilaterally.