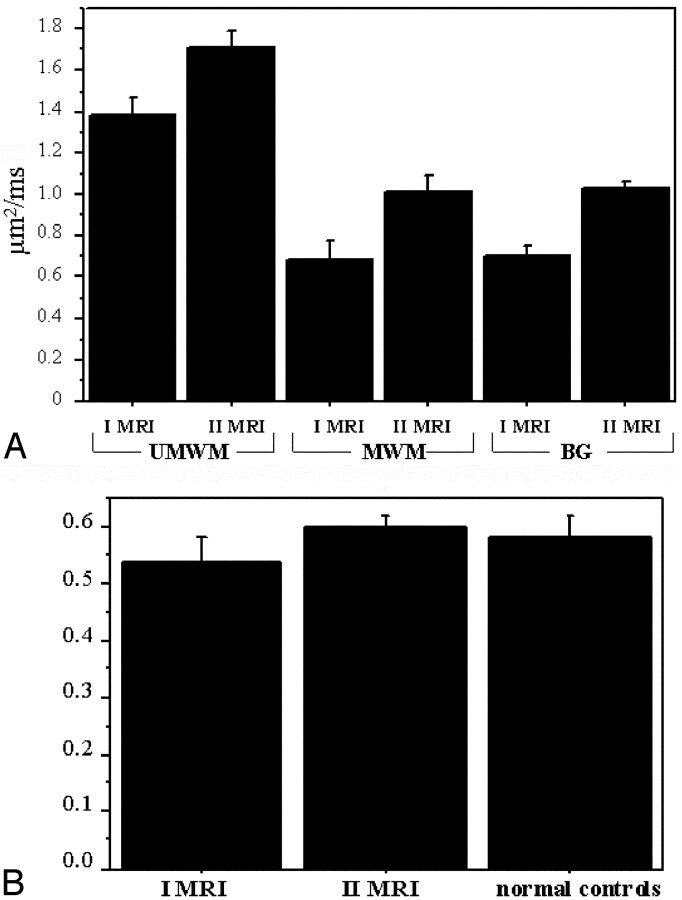
Fig 3.
A, Graph shows plot of the average apparent diffusion coefficient value (with standard deviation of unmyelinated white matter [UMWM]), myelinated white matter (MWM), and basal ganglia (BG) regions of interest in the first (I MRI) and second (II MRI) MR imaging study. B, Graph shows plot of the average value (with standard deviation) of the ratio between T2-weighted signal intensity of frontal-occipital unmyelinated white matter and of cerebrospinal fluid in the first and second MR imaging studies and in normal controls (n = 5).

