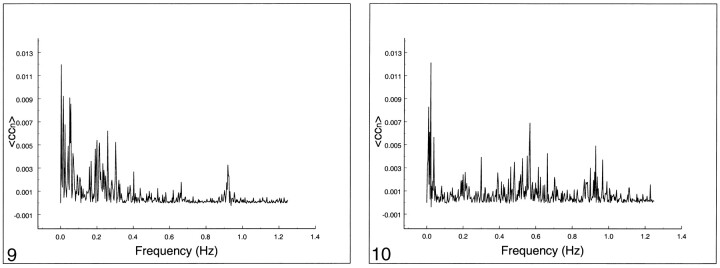
fig 9.
Spectral analysis of the average correlation coefficient from a seed voxel in the left jugular vein. Note the spread over many frequencies up to 0.4 Hz and the cardiac peaks at 0.93 Hz and 0.65 Hz.fig 10. Spectral analysis of the average correlation coefficient obtained using a seed voxel in the left ventricle. Note the spread over many frequencies. The cardiac bands show a large spread compared with other tissue. Low-frequency peaks are visible at 0.03 Hz

