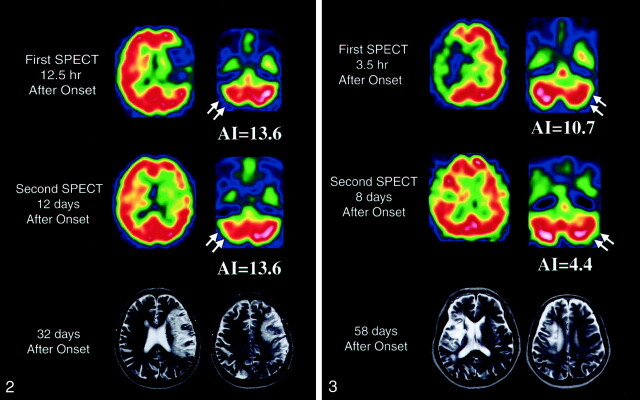
Fig 2.
SPECT images obtained in patient 1 show severe cerebellar hypoperfusion (arrows) in both the acute (top row) and subacute (middle row) stages. This patient had SSS scores of 13 at admission and 38 at 60 days after onset. MR images (bottom row) obtained at 32 days show a large infarct in the left hemisphere.

