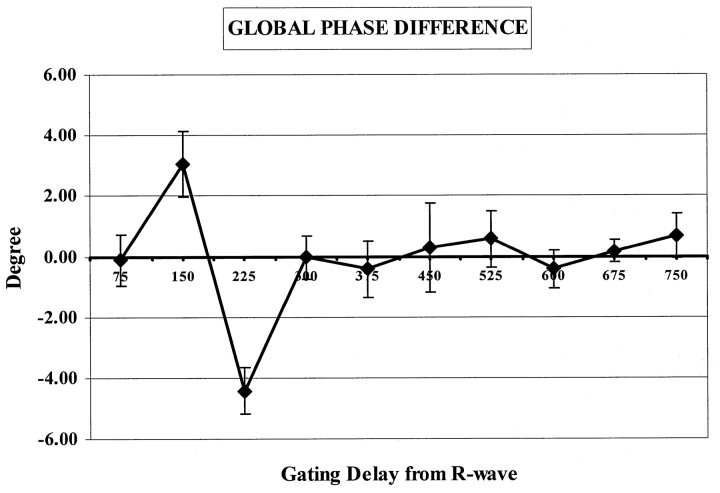
Fig 3.
Plot shows the global phase difference in the water signal (global phase at each time point minus the mean global phase) in the five subjects. The large change in the global phase difference during the systolic phase (75–300 milliseconds) of the cardiac cycle indicates a large amount of brain motion during that period. A relatively small global phase difference is observed after 300 milliseconds; however, the error bars are large ( 300–600 milliseconds). These indicate that some brain motion occurred in some subjects. The global phase difference and the error bar is small at the 675-millisecond delay; this finding indicates minimal brain motion in all of the subjects.

