Figure 2.

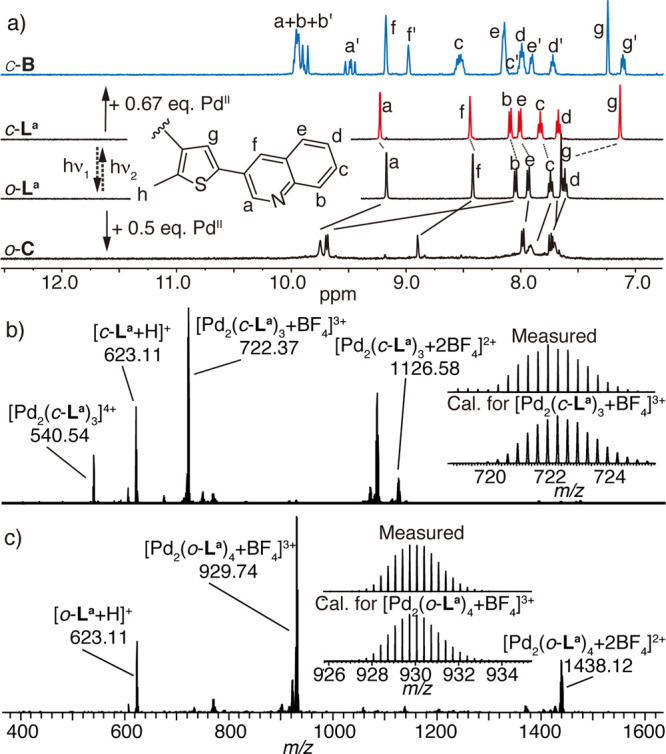
(a) 1H NMR spectra (500 MHz, CD3CN, 298 K) of ligands o-La, c-La, o-C, and c-B. (b, c) ESI-MS spectra of (b) c-B with isotope pattern of [c-B+BF4]3+ shown in the inset and (c) o-C with isotope pattern of [o-C+BF4]3+.

(a) 1H NMR spectra (500 MHz, CD3CN, 298 K) of ligands o-La, c-La, o-C, and c-B. (b, c) ESI-MS spectra of (b) c-B with isotope pattern of [c-B+BF4]3+ shown in the inset and (c) o-C with isotope pattern of [o-C+BF4]3+.