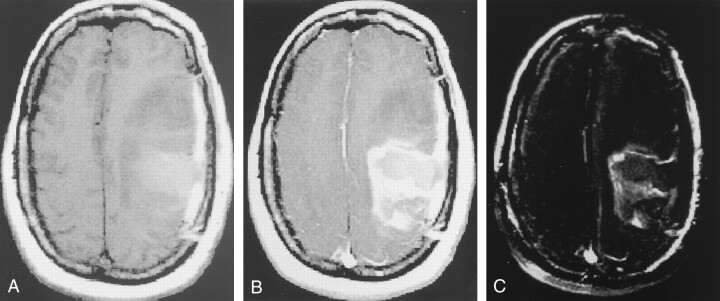
Fig 2.
Images illustrate step 3: segmentation of enhancing tumor.
A, IT1, or T1-weighted axial image, demonstrates the postoperative cavity in the left frontoparietal area, with hemorrhage, edema, and possible residual tumor.
B, IT1e1, or axial image obtained after the administration of gadolinium-based contrast material, shows rim enhancement along the margins of the postoperative cavity, as well as anterior nodular enhancement. Note the overlying postoperative dural enhancement.
C, I′T1e1 − IT1, or axial image obtained after subtracting the registered, resection volume in B from the volume in A, shows that only areas in which signal intensity increased on B compared with A have high signal intensity.

