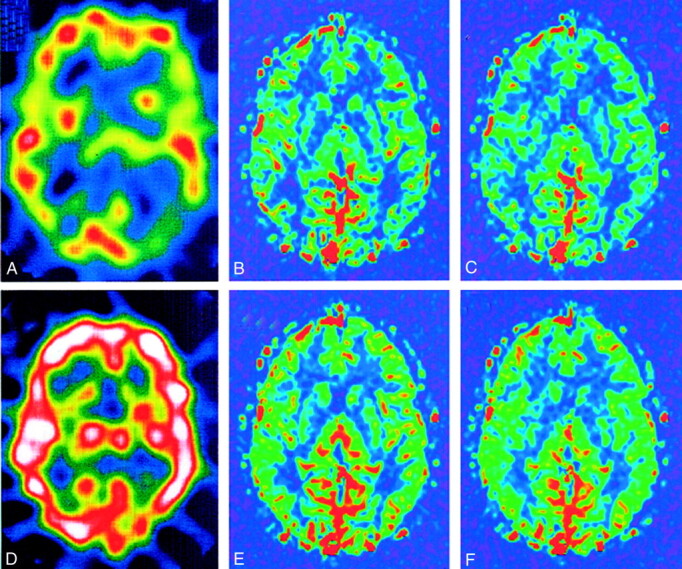
Fig 2.

123I-IMP images in a representative case show normal perfusion. Although relatively decreased perfusion is seen at the left parietal-occipital region in A, quantitative analysis showed flow of more than 30 mL/100 g/min, with markedly increased flow after acetazolamide administration. Note similar cerebral blood flow depictions on both pre- and post-acetazolamide FAIR images.
A, Pre-acetazolamide 123I-IMP image.
B, Pre-acetazolamide FAIR image obtained with a TI of 1200 milliseconds.
C, Pre-acetazolamide FAIR image obtained with a TI of 1400 milliseconds.
D, Post-acetazolamide 123I-IMP image.
E, Post-acetazolamide FAIR image obtained with a TI of 1200 milliseconds.
F, Post-acetazolamide FAIR image obtained with a TI of 1400 milliseconds.
