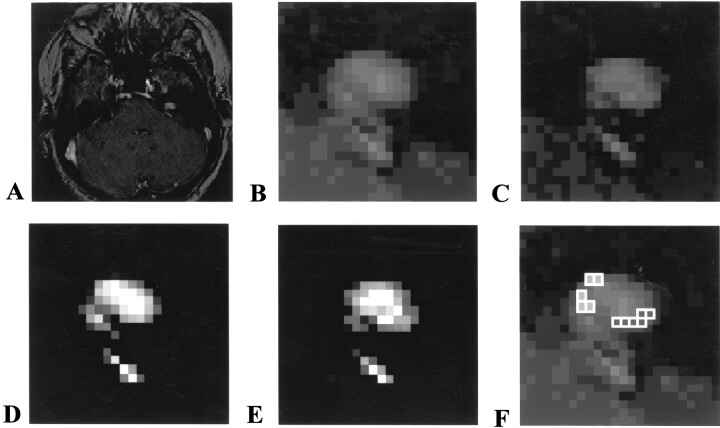
Fig 5.
Example of follow-up study of vestibular schwannoma, illustrating a small tumor with no evidence of growth.
A, Initial image of a 0.8-cm vestibular schwannoma.
B, Magnified view of initial image.
C, Follow-up image obtained after 11 months.
D, Probability map of initial tumor location.
E, Probability map of final tumor location.
F, Subtraction map shows differences of more than +25% (open squares) and less than −25% (shaded squares) in voxel volume change after subtraction of the two probability maps shown in D and E. This shows that the tumor has moved in the second image relative to the first, that all differences are due to partial volume changes, and that the number of voxels with apparent volume loss is matched by the number with volume gain. Overall difference in volume of the whole tumor is one voxel, well within the accuracy of the measurement.

