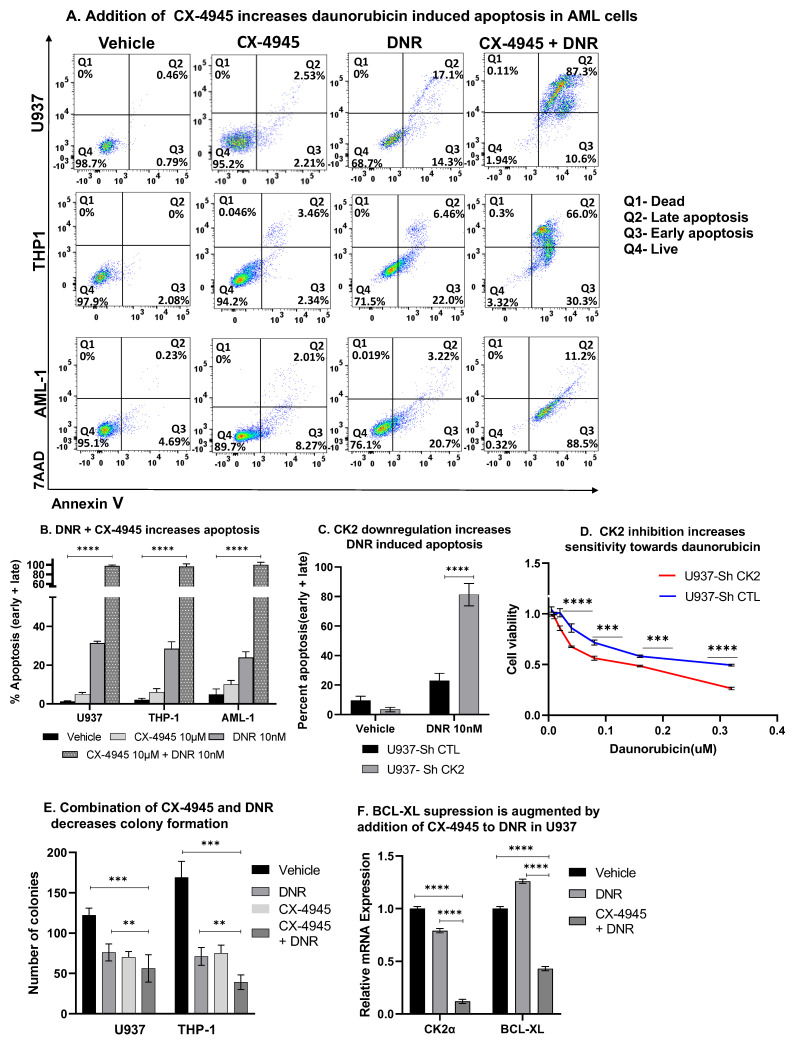
Figure 7.
CK2 inhibition potentiates daunorubicin-induced apoptosis in AML cells. Cells were treated with 10 µM of CX-4945 or a combination of 10 µM CX-4945 with 10 nM of daunorubicin for up to 48 h. Cells were stained with 7-AAD and Annexin V for flow cytometry to assess apoptosis. (A) Flow plots showing representative results from three replicate experiments. The percentage of cells in the right upper and lower quadrant of each flow chart represents the percentage of late and early apoptotic cells, respectively, in U937 (top row), THP-1 (middle row), and AML-1 cells (bottom row) Q1: Dead, Q2: Late apoptosis, Q3: Early apoptosis, Q4: Live. Graphed in (B) are the mean +/−SD of triplicates from two independent experiments showing the percent of apoptosis cells following the drug treatment, as indicated above. (C) CK2α silencing in U937 cells achieved using ShCK2α and sorted for GFP after 24 h. Sorted cells were treated with 10 nM of DNR for 24 h before staining for Annexin V and 7AAD to assess apoptosis. The graph shows the combined percent apoptotic cells (early + late) in each group with and without the DNR treatment. (D) Cytotoxic drug response measured by the MTT assay after treating CK2α ShRNA treated U937 cells and the respective controls with various daunorubicin concentrations for 24 h. (E) Cells were pretreated as above for 48 h and were plated in a Methocult medium. Colonies were counted under an inverted light microscope. Colonies that contained around 50 cells or more were counted for analysis. Graphed in Figure 7E is the number of colonies after 14 days as the mean of three replicates +/− SD of two independent experiments. (F) The qRT-PCR showing decreases in the mRNA level in U937 cells treated with daunorubicin alone (10 nM) or a combination of CX-4945 and daunorubicin. p-value summaries are as follows: p > 0.05 (ns); p < 0.01 (**); p < 0.001 (***); p < 0.0001 (****).

