
fig 5.
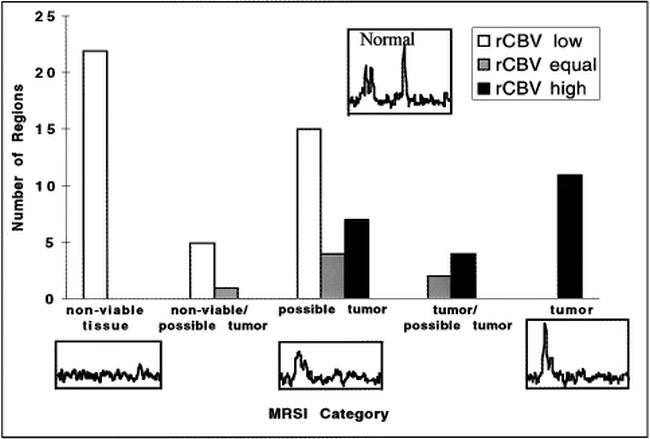
Correlations of MR spectroscopy (MRSI) and rCBV for regions interpreted on the conventional MR images for all gliomas. There was a strong correlation (P < .001) between the rCBV assessed from the maps and their corresponding spectra. In particular, no clear tumor spectral pattern was found in the regions with rCBV below normal. Tumor spectral patterns were found in 15 of 22 regions with elevated rCBV; the remaining seven regions had spectral patterns suggestive of possible tumor. Regions on the rCBV map were determined to be lower than, equal to, or higher than the rCBV of normal-appearing contralateral white matter remote from tumor and outside the treatment port