
fig 4.
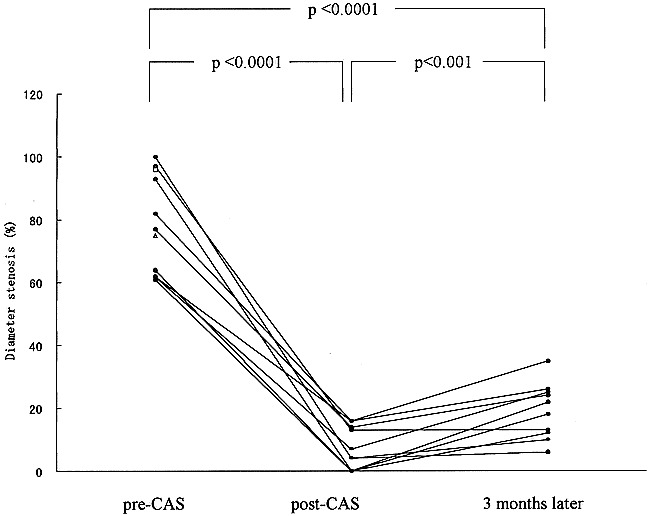
Changes in the percentage of diameter stenosis on the angiograms obtained before (pre-CAS) and immediately after (post-CAS) treatment and at the 3-month follow-up. There is significant reduction of the stenosis rate between the pre-CAS and immediate post-CAS angiograms (P < .0001, paired Student's t-test)