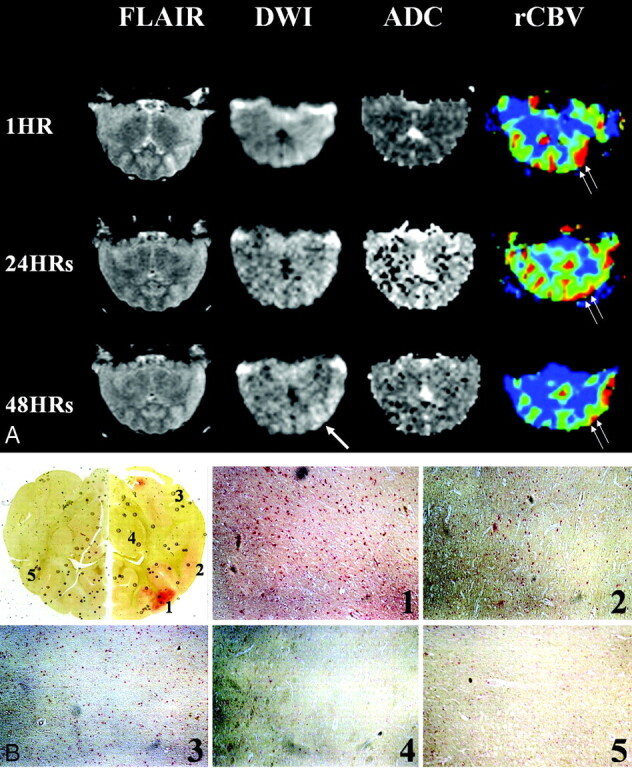
Fig 3.

Findings in the area of persistent hyperperfusion.
A, Serial FLAIR, diffusion-weighted, and perfusion-weighted images show persistent hyperperfusion in the frontal and temporal cortices. Increased rCBV is most prominent the inferior frontal regions (double arrows). Initial FLAIR image shows cortical swelling; however, diffusion-weighted imaging does not depict abnormalities. The last diffusion-weighted images show gradually increasing signal intensity in the affected hemispheric cortex (single arrow), where persistent hyperperfusion is still observed.
B, Light photomicrographs showTUNEL staining. Red-stained areas are not hemorrhagic foci, but highly TUNEL-positive lesions coinciding with areas of hyperperfusion on perfusion-weighted images. HPF images (original magnification ×200) show multiple TUNEL-positive cells consisting of neurons and astrocytes. Density of positive cells is higher in affected frontotemporal regions than on the normal side. Red cells are also seen in the striatum that was subjected to normal perfusion and even in the contralateral cortex, but the number was less than that for the lesions. (1 indicates inferior frontal gyrus; 2, superior temporal gyrus; 3, inferior temporal gyrus; 4, striatum; and 5, normal contrlateral cortex.)
