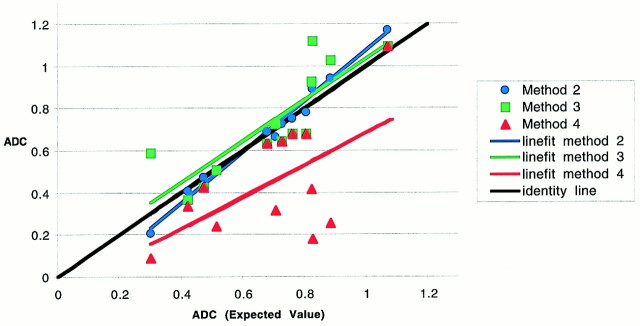
fig 4.
Plot of average ADC of hematomas for method 1 (expected values) versus methods 2, 3, and 4 (at 2% masking) with line fits. A nearly perfect correspondence is shown between ADC values computed using method 1 and method 2 (mean ROI) (intercept = −0.13, slope = 1.2, R2 = 0.98, standard error = 0.038). Although method 3 (negative masked voxels) shows a slope close to identity, the fit is not as good as for method 2 (intercept = 0.056, slope = 0.98, R2 = 0.71, standard error = 0.144). Method 4 shows a poor correspondence with method 1 (intercept = −0.076, slope = 0.759, R2 = 0.36, standard error = 0.233), most notably at the lower ADC values

