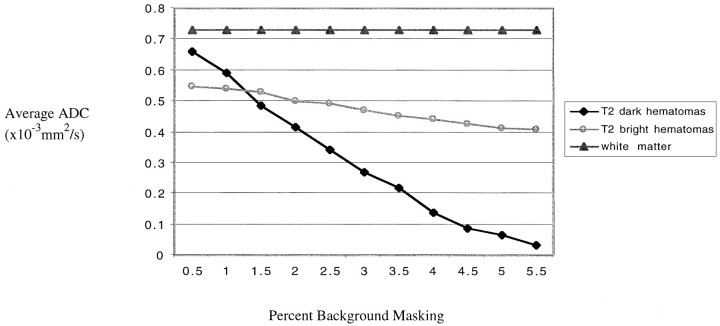
fig 5.
Average ADC plotted against percent background masking. For the T2-dark hematomas, a dramatic decrease in ADC values is evident as more of the masked voxels (with values of 0) are included in the computation. For the T2-bright hematomas, there is only a small decrease in ADC values across the range of masking values. There is no variation in the ADC of white matter values, which shows that background masking becomes an issue only with areas of very low T2 signal

