
Fig. 2 |. Relationship between polygenic scores and novel phenotypes.
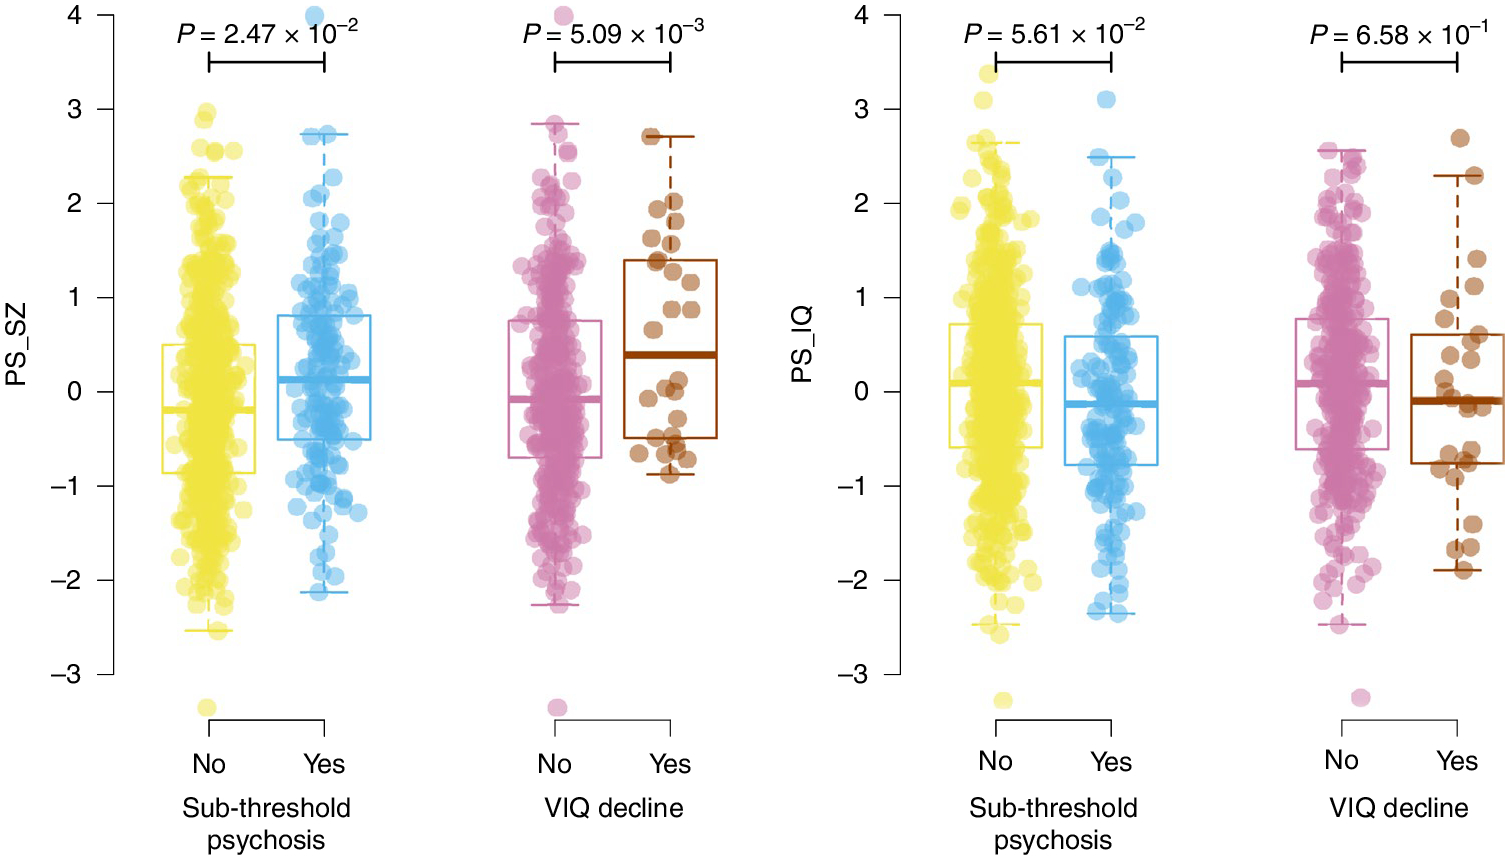
Results show per-individual values as well as summaries per group, where minimum and maximum values are directly observable from the plot; the box plot center is the median; the box plot edges represent the 25th and 75th percentiles; and the whiskers represent the lesser of the distance to the minimum or maximum value or 1.5 times the interquartile range. Results are shown for regressions of sub-threshold psychosis versus merged controls (n = 755) and VIQ decline (n = 396) for both PS_SZ (left) and PS_IQ (right). P values are reported for two-sided logistic regression analyses uncorrected for multiple testing using covariates as specified in the Methods.