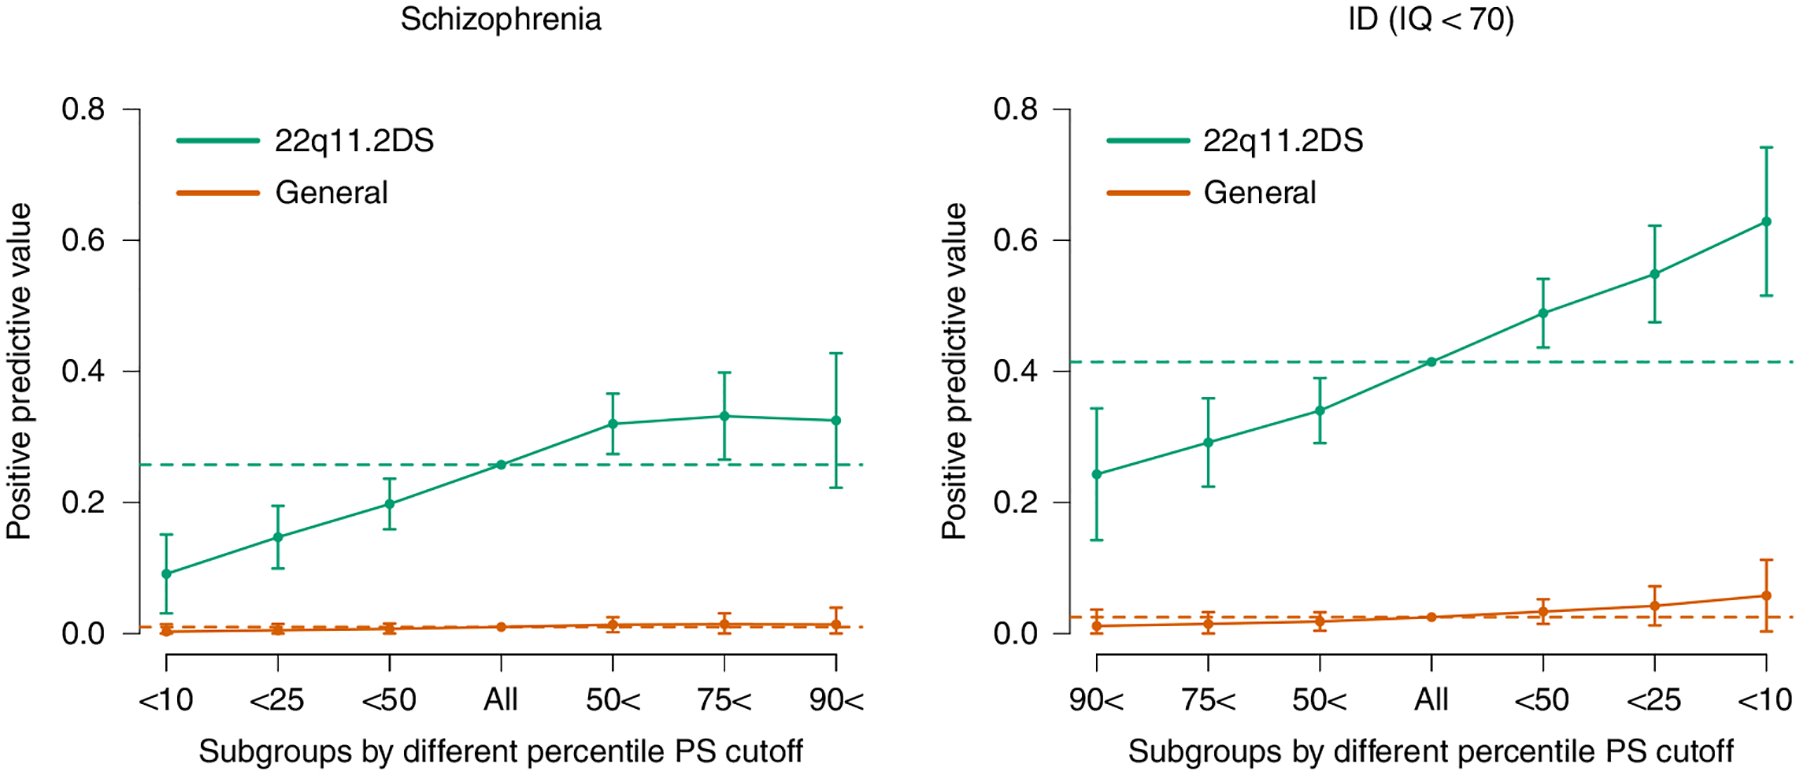
Fig. 3 |. Individual risk prediction.

PPVs (y axis) for SSD (left) and ID (right) based on various cutoffs of PS_SZ (left) or PS_IQ (right). Colors differentiate values from the 22q11DS cohort (turquoise) versus values estimated from the general population (orange) given observed prevalences in the population (SSD = 0.01 and ID = 0.025; dotted lines) and observed ORs. Whiskers represent confidence intervals (±1.96 × standard error) around the central PPV estimate.
