
Extended Data Fig. 1 |. Relationship between polygenic scores and previously studied phenotypes.
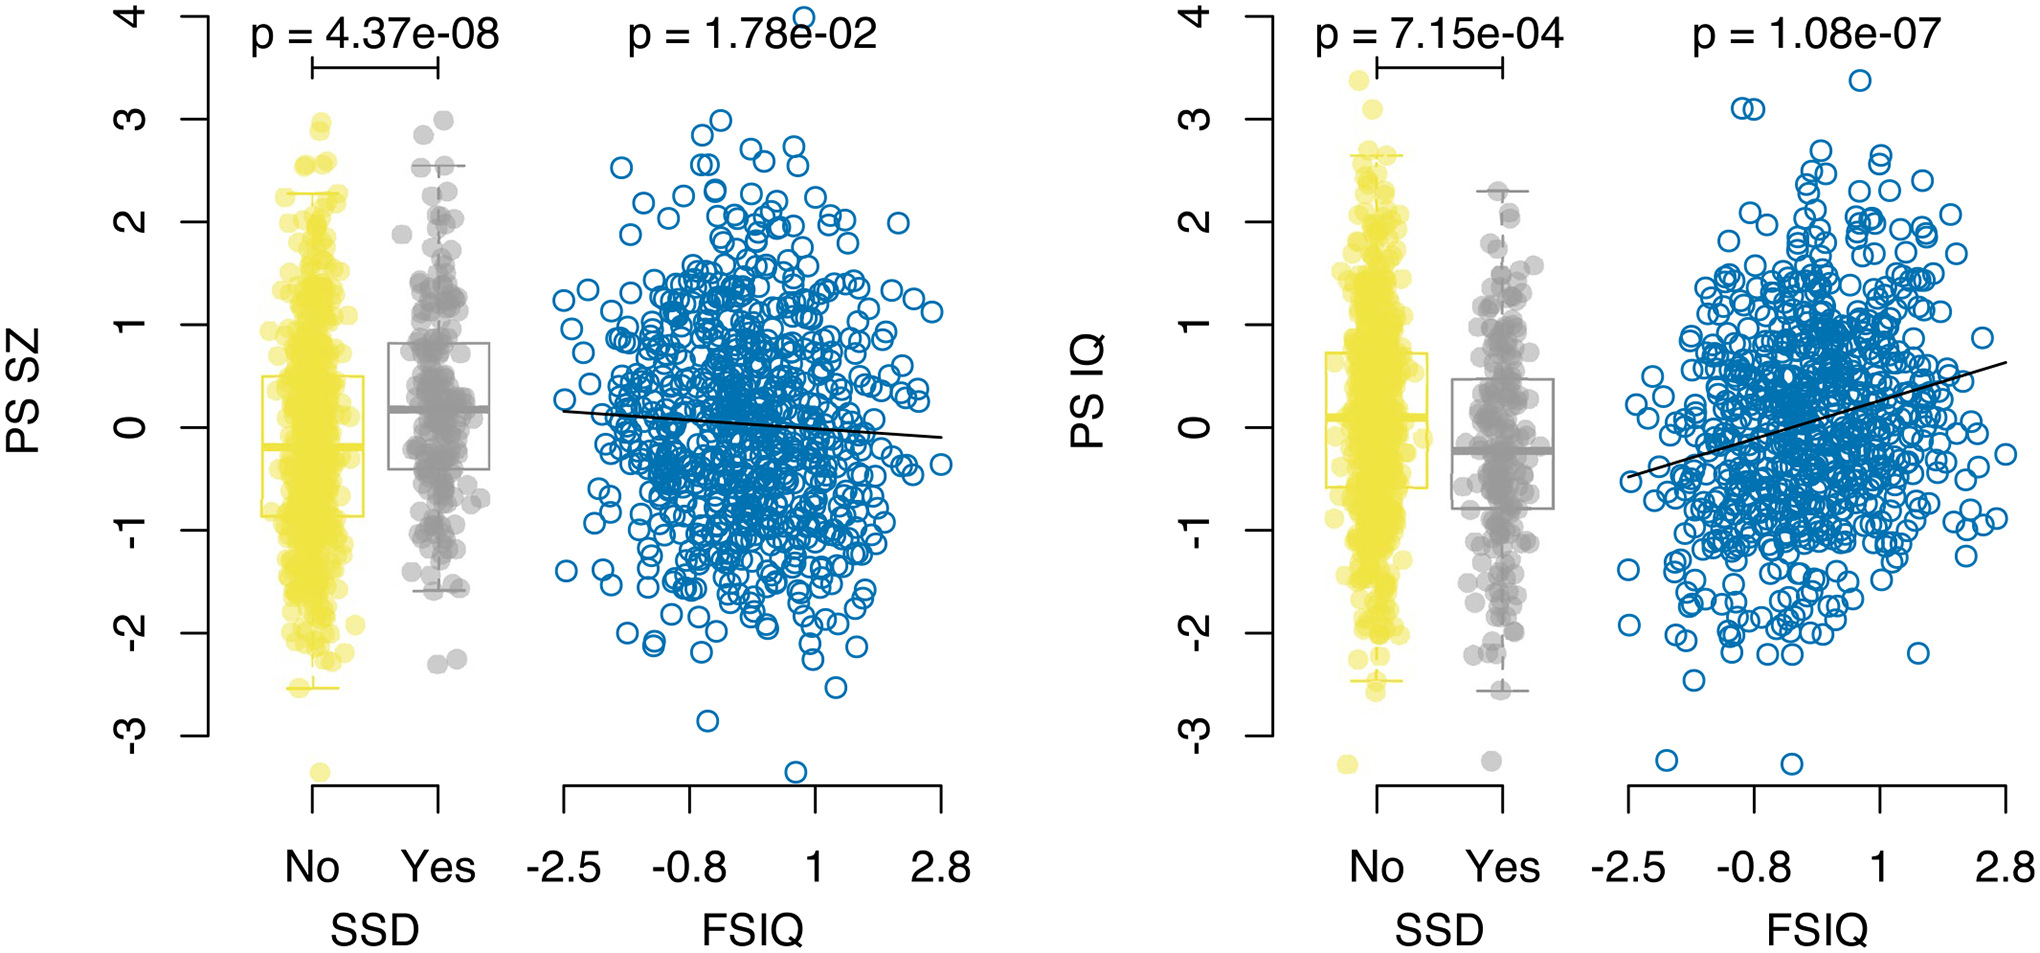
Results for the binary SSD phenotype show per-individual values as well as summaries per group, where minimum and maximum values are directly observable from the plot, the box-plot centre is the median, the boxplot edges represent the 25th and 75th percentiles, and the whiskers represent the lesser of the distance to the minimum or maximum value, or 1.5 times the inter-quartile range. Results are shown for logistic regression of SSD on controls (N = 802) and linear regression for FSIQ (N = 720), for both PS_SZ (left panel) and PS_IQ (right panel). P-values are reported from regression analyses and are two sided and are not corrected for multiple testing.