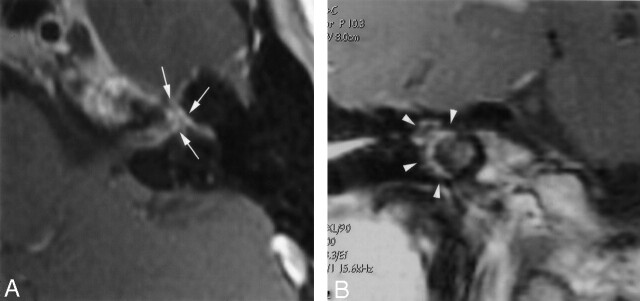
Fig 3.
Axial (A) and coronal (B) T1-weighted gadolinium-enhanced images (TR/TE/NEX, 500/20/3; section thickness, 3 mm) through the level of the distal internal auditory canal (axial) on the left, and the cochlea (coronal) on the right side. Enhancement is depicted in the fundus of the internal auditory canal, along the labyrinthine and proximal tympanic segments of the facial nerve, and in the geniculate ganglion (arrows). Further bandlike, pericochlear contrast enhancement is demonstrated, corresponding to the areas of CT hypoattenuation (arrowheads).

