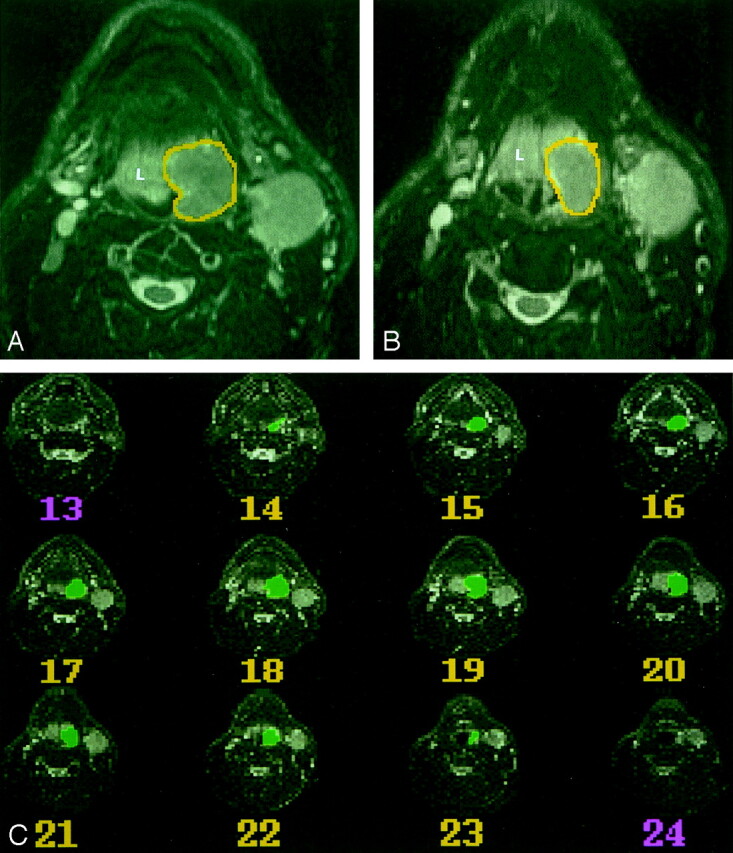
Fig 1.

MR imaging–based volumetric analysis of a carcinoma on the left side of the base of the tongue in a 54-year-old man.
A and B, Two sequential axial T2-weighted MR images (4000/100/2) were used to outline the primary tumor on each sequential axial image by using a mouse-controlled cursor. In this case, the neoplasm (outlined) is hypointense relative to the lymphoid tissue (L) of the lingual tonsil.
C, Serial axial T2-weighted MR images (4000/100/2) show all images where a primary tumor is present, and the outlines of the tumor on each section. A computer program calculated the volume by counting voxels included within the outlined regions.
