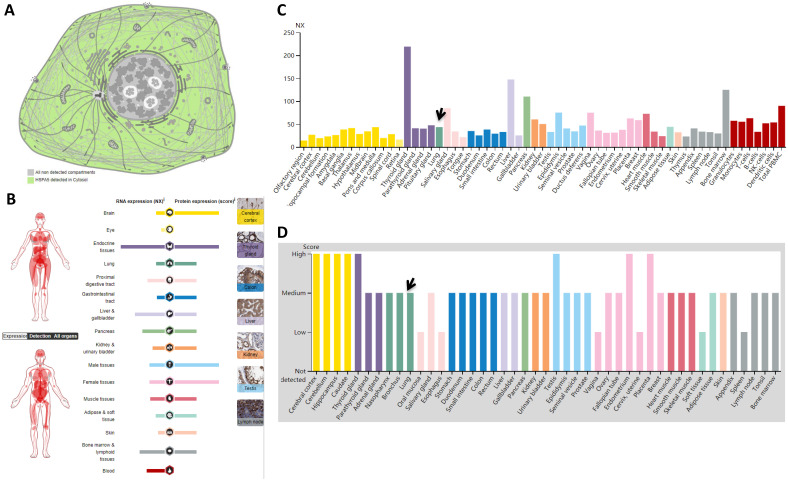
Figure 1.
Localizations and expressions of HSPA5 in normal tissues. A. Cellular localization of the HSPA5 protein. Green in color indicates HSPA5 detected in cytoplasm, whereas gray in color indicates the absence. B. The summary of mRNA and protein expressions of HSPA5. Color-coding columns are based on tissue groups, each consisting of tissues with functional features in common. The respective images for normal tissues with staining of HSPA5 protein in the HPA (scale bar 200 µm). C. The mRNA expressions of HSPA5 in normal tissues. Consensus dataset of mRNA level are derived from HPA dataset, GTEx dataset, and FANTOM5 dataset. A NX value of 1.0 is defined as a threshold for HSPA5 mRNA expression. D. The HSPA5 protein expressions in normal tissues from the HPA. Protein expression data are shown for each of the 44 tissues. Arrows indicate the lung tissue. HPA, Human Protein Atlas.

